Hi guys.
Can anyone please explain the graph in statistics section. It’s poorly annotated, especially the two curves with same colour and same labels confuses more.
Thanks in advance.
JumpingBuddha
Hi guys.
Can anyone please explain the graph in statistics section. It’s poorly annotated, especially the two curves with same colour and same labels confuses more.
Thanks in advance.
JumpingBuddha
@Taher could you please explain this. I don’t get it either…
That’s due to the default theme dear @vickyx (in your settings). You can change the colour by changing theme.
Okk, I see… Thanks
Lol I thought I’m the only one who didn’t understood the graph … 

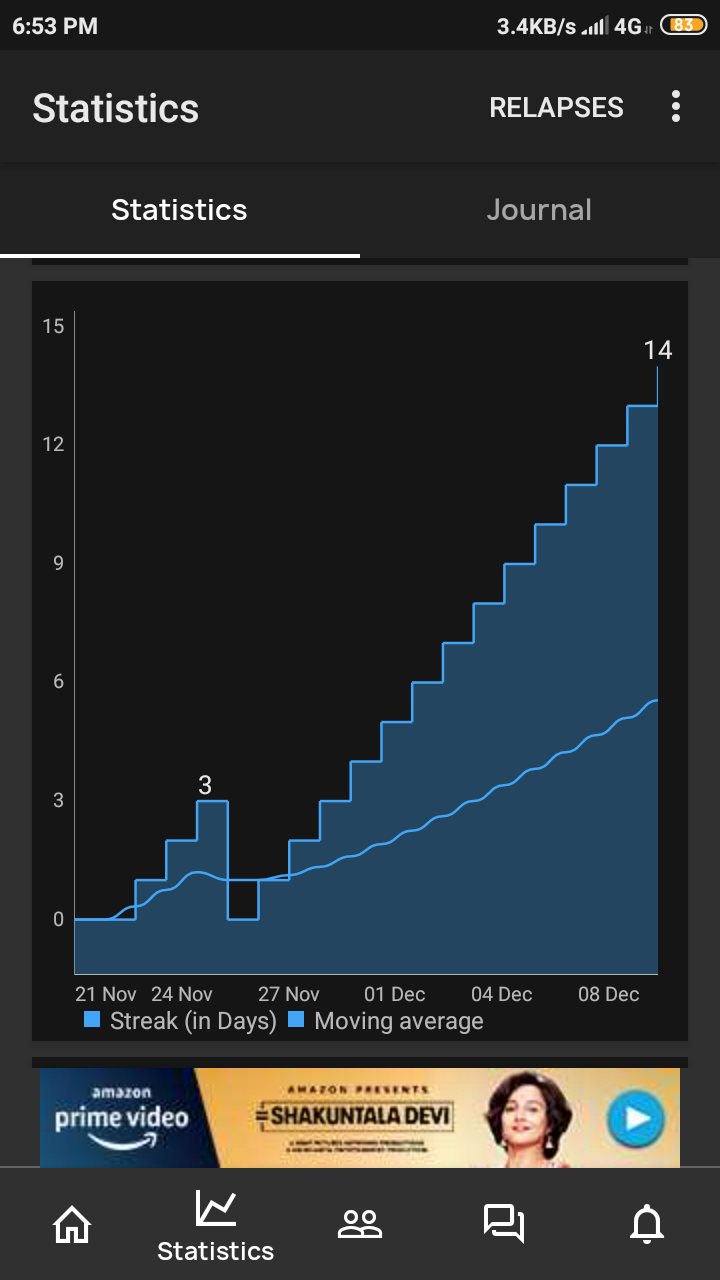
Even I don’t get it exactly but from what I make out of it is that the steps like graph is the number of days ur streak lasts (streak in days) and the wave like line is your average slip ratio meaning
Eg if you slip 6 times in 2 months. Once after completing 10 days (10 steps) once after 2 days (2 steps) once after completing 12 day (12 steps) and so on you keep sliping , total number of times you sliped is 6 times so on average you sliped after every 10 days
Get it
2 months (60 days) dived by number of slips (6 times )
= 10 your average slip ratio
Hope you got it
Thanks for your effort. But it is still not clear. I assume you mean relapse by the term slip.
For example,
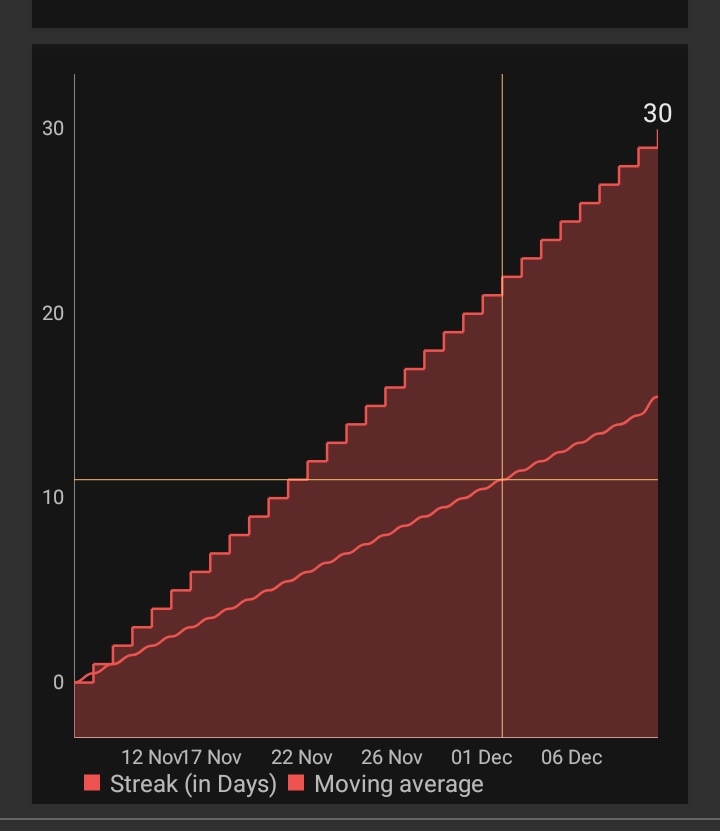
In last week I never relapsed. So my streak is 7(steps) but the moving average is shown as 4(curve).
Similarly in last two weeks steps show 14 whereas curve shows 7.5.
Similarly in last month steps show 30 and curve show 15.5
Still need clarification ![]()
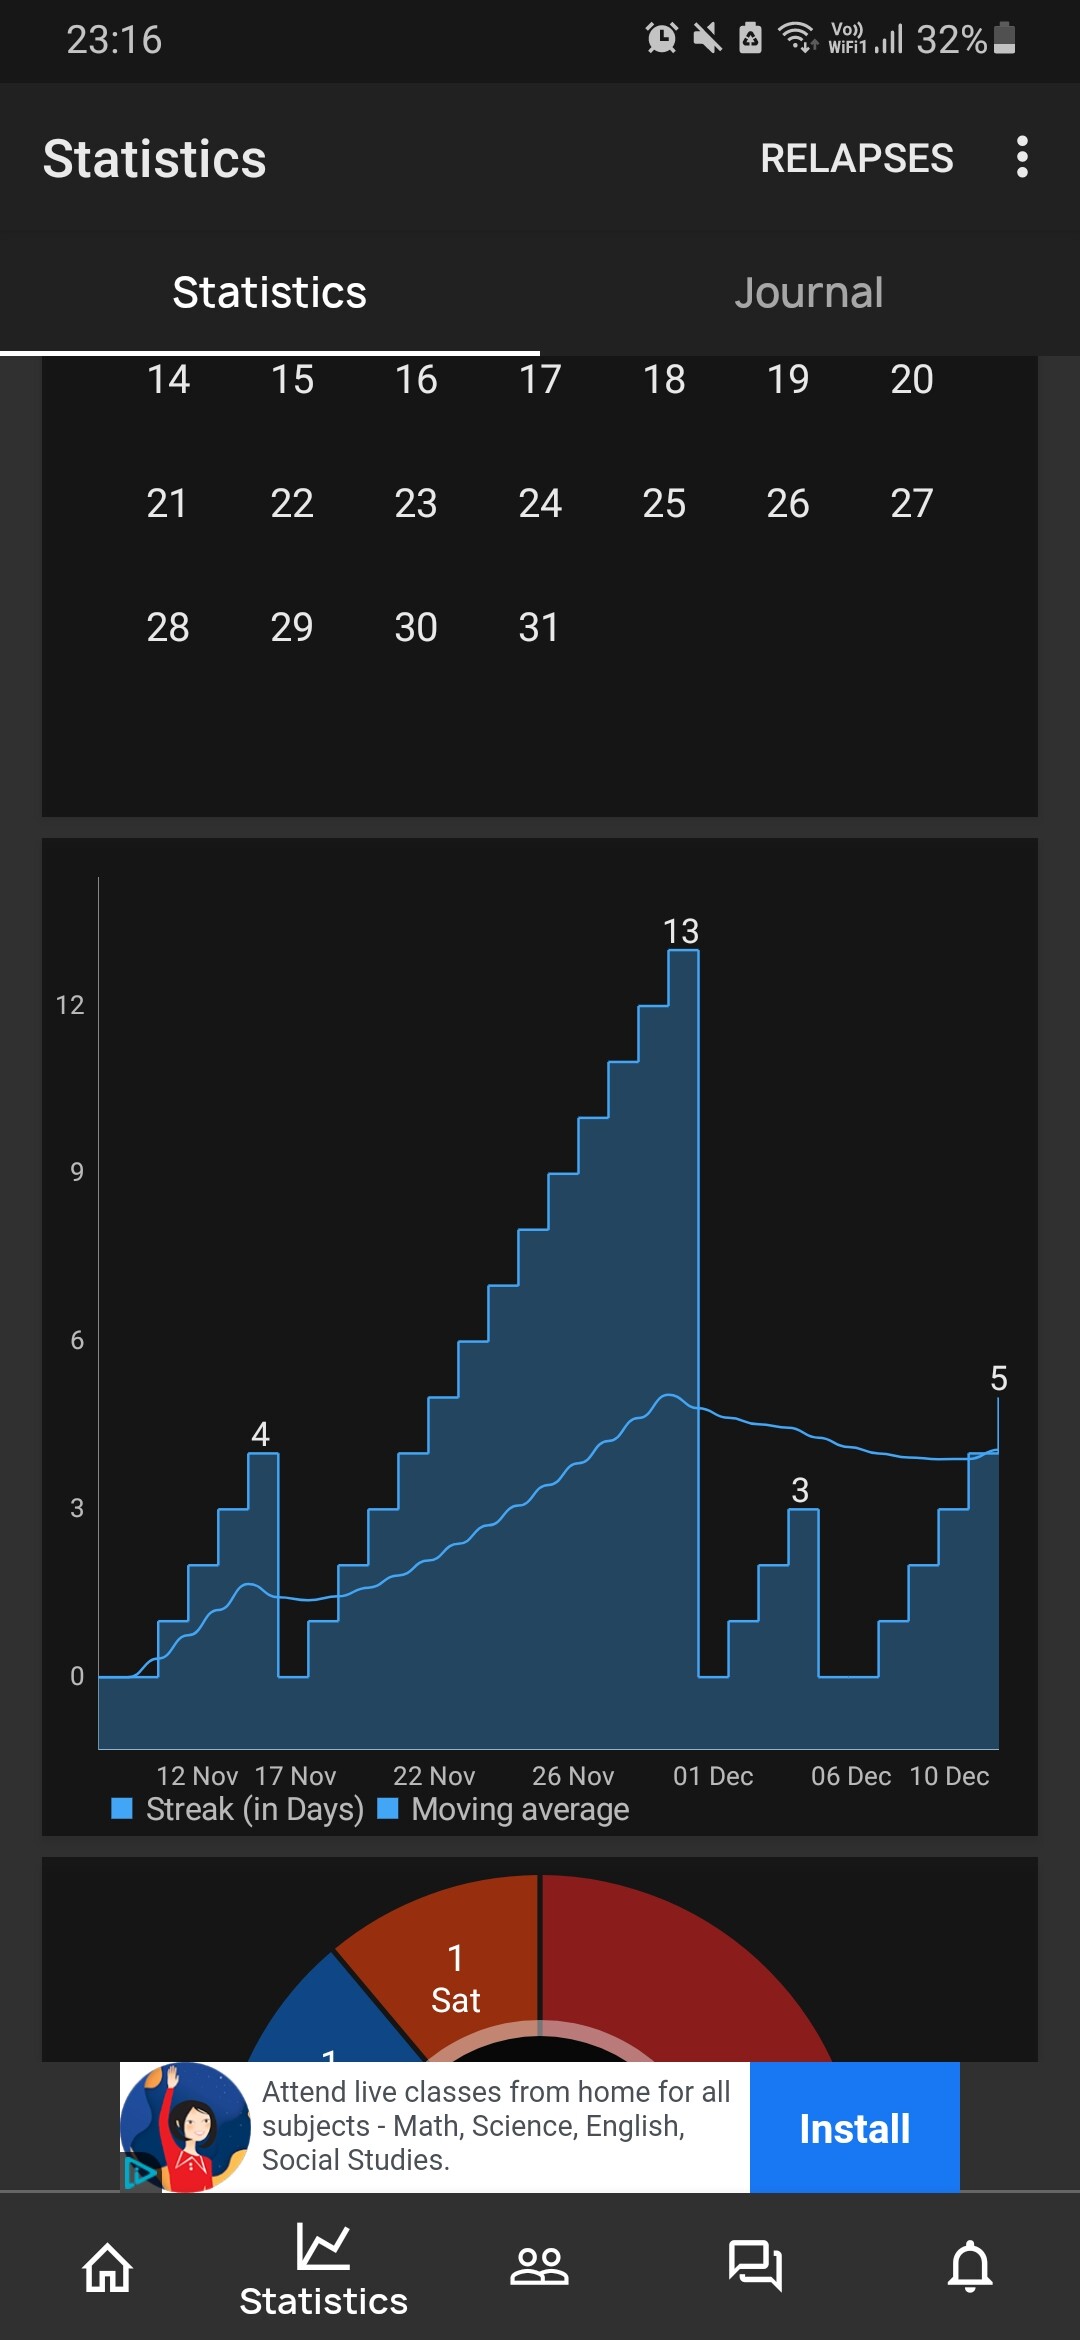
![]()
@Taher can you explain please?
It’s calculating average. By calculating summation of days and dividing it by number of samples
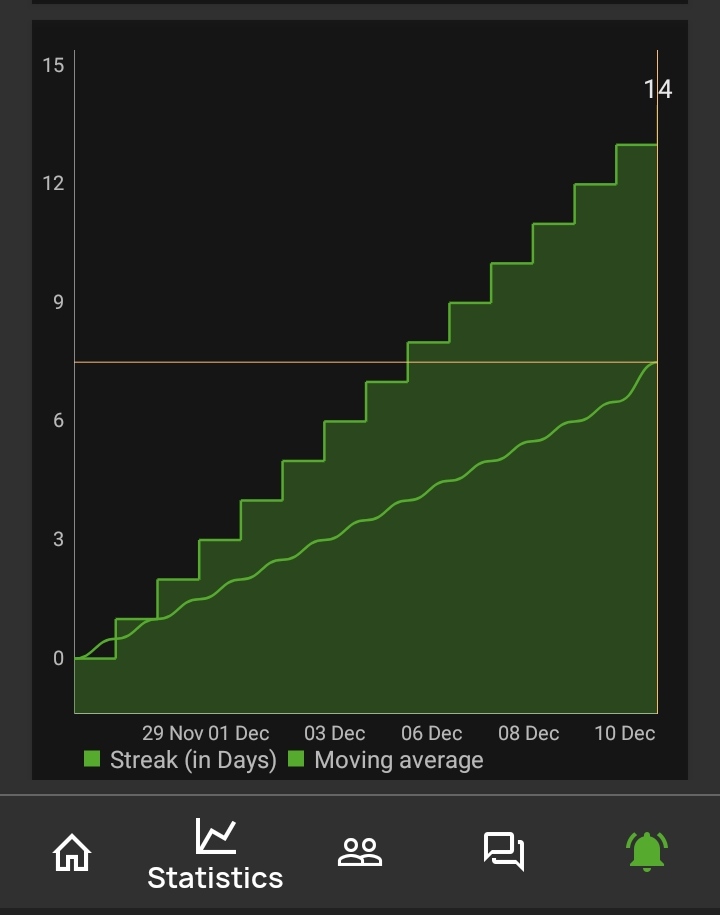
In your graph, it will be (0+1+2+3…+14)/15 = 7
If suppose you relapsed at day 20, sample for day 20 will be zero. And the summation will be divided by 21…
This is what I understand, I may be wrong too.
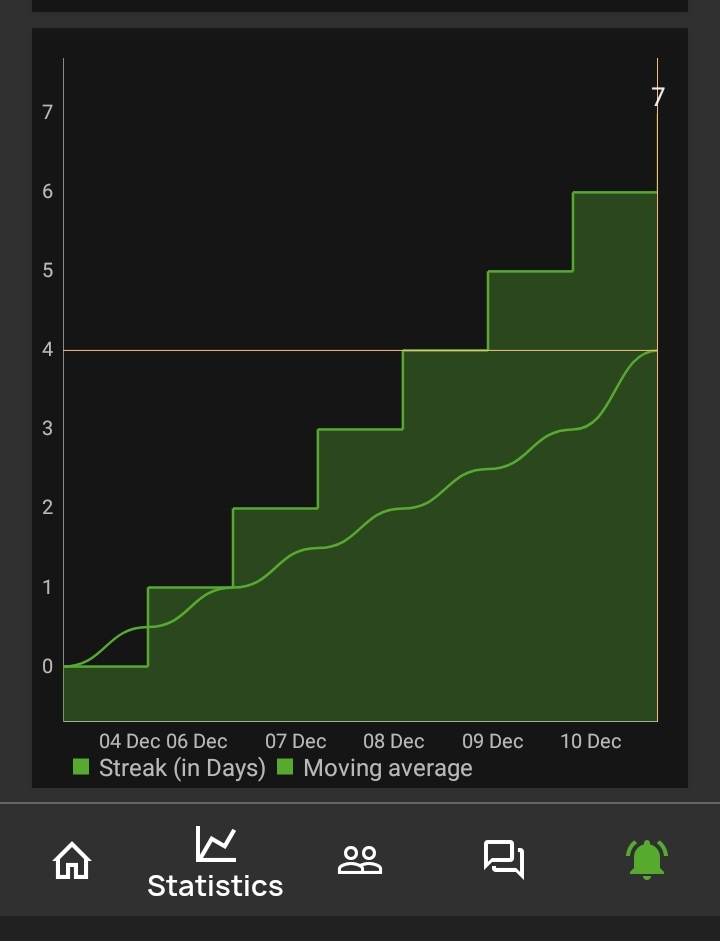
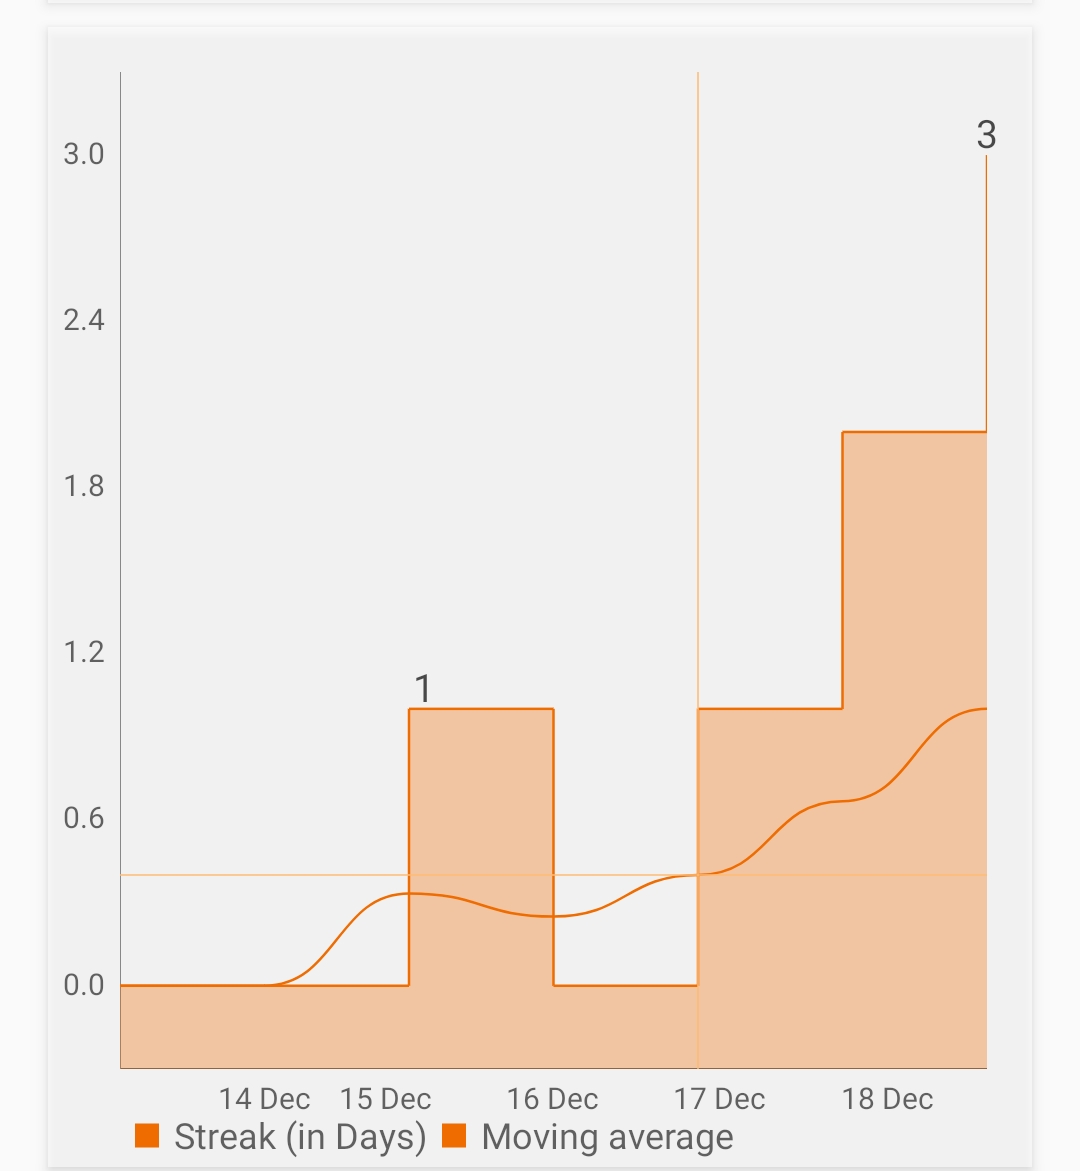
This is my graph.
Average = (0+0+1+0 +1+2+3) / 7= 1
Thanks dear @Kingslayer,
So it’s like,
Moving avg on day X=cumulative streak at day X/X
Where streak on the day of relapse =0