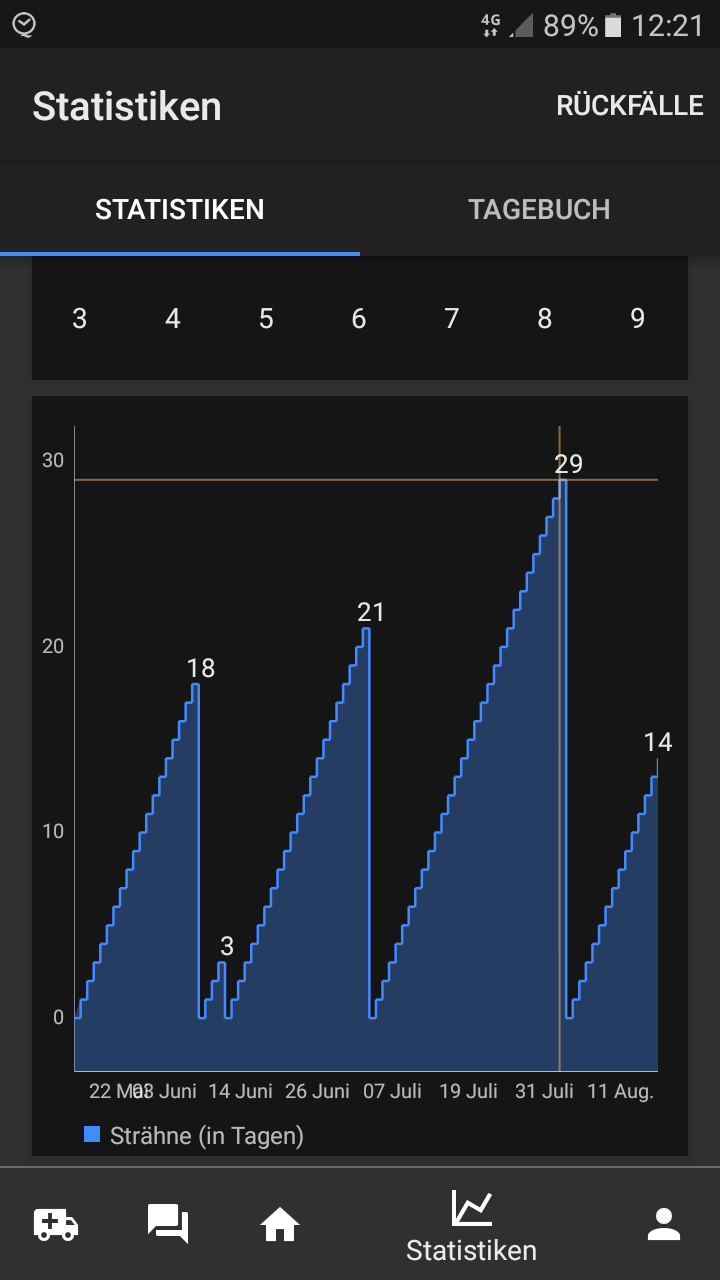
The graph shows different lengths of my streak depending on the number of months i select
(look at the 4th one. It varies from 9 to 17 and 18 for 1month, 6months and 3months)
The streak where it shows 9 days, only counts the streak from the day 30 days ago. If my streak started on the 20. of feb to 10. of march it will only count the 10 days of march for example and not the whole streak (if you know what I mean. I don’t know if that is intended like this)
But it is weird that it switches from 17 to 18 for 3 and 6 months
Firstly I enjoy the new design and features in the statistic section - my appreciation for your work @Taher!
I found another calculation mistake: the average streak calculated i.e. for a 3 month period is wrong. Look at the screenshots: